Success Starts with Emotional Connection
ARC specializes in making complex Quality Assurance (QA) processes simple. Our boutique approach to service ensures we can guide companies of any size through a customizable QA journey, providing expert support and meaningful solutions.
These Brands Trust ARC To Deliver Excellence and Innovation














We Offer Flexible Solutions To Improve Customer Experience Results
AIQA
Use AI to enhance your speech analytics
- Human Verified Quality Assurance
- Massive Cost Savings
- Speech Analytics
- Increased Agent Performance
Telephone Mystery Shopping
Secretly shop agents and competitors
- Phone, Email & Chat Insights
- Competitor Analysis
- Editing
Coaching
Improve individual strengths
- One-on-One & Team Coaching
- DiSC Workshops, Assessments and Workplace Motivators
- Train-the-Trainer
- Sales Effectiveness
Surveys
Improve customer retention and reduce contact center agent turnover
- Customer Satisfaction Surveys
- Employee Engagement Surveys
- Turn Customer Insights into Action
CX Optimization
Give yourself a strong competitive advantage and drive business growth and success
- Increase Customer LTV
- Lower Acquisition Costs
- Increased Revenue
- Establish A Great CS Team
Results We Deliver

CX is Only The Beginning
We help Contact Center Heads, COOs, CMOs, CXOs and other company leaders improve their Customer Experience (CX). But that is just the beginning. In which of the following areas do you need the most help?
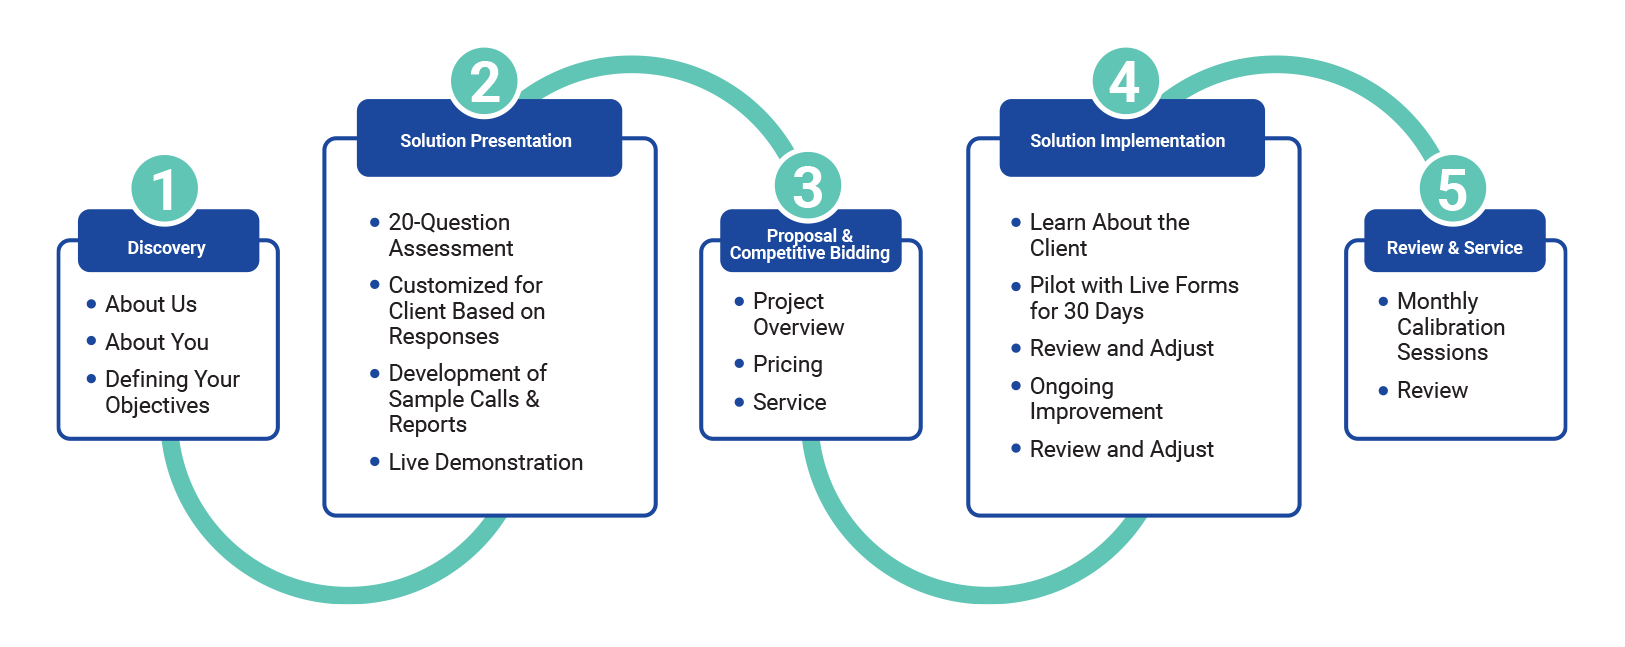
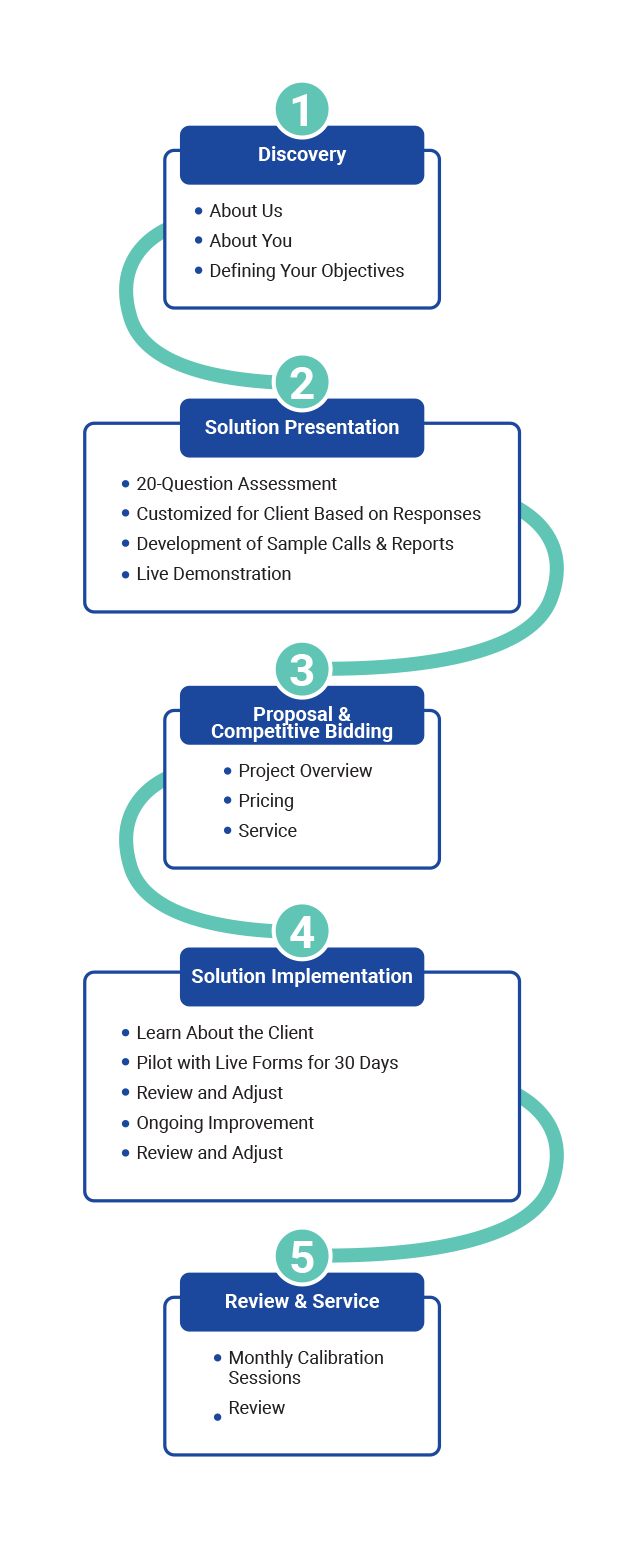
Our Proven Process
100% Satisfaction Guarantee
Replacement of any audit/shop at no cost
Quality Monitoring Dashboard
Our analysis and reporting forms are carefully crafted to bring you the information you need to improve your contact center's performance.
Areas our team's analysis and reporting evaluate
- Procedural Accuracy
- Telephone Information
- Impression, Comments, and Reports
- Technical Accuracy
- Phone, Email, and Chat Etiquette

Our Mission is to help our clients deliver outstanding service with every interaction
ARC has always had the goal and vision of developing partnerships with each client we serve, ensuring the data received is accurate, actionable, and insightful. We offer an integrated solution that provides our clients with the information they need to drive sales, develop a strong service culture within their organization, and to keep them at the forefront of their industry in customer satisfaction and retention.
Our programs are designed with your company in mind. We are dedicated to helping you implement the best possible customer service practices through detailed analysis.
Why Our Clients Trust Us
Improved Operational Efficiency and Quality
``ARC was very receptive to our needs from the very beginning and I could tell that they were going to be a pleasure to work with. They are open to new ideas and very creative - they really go the extra mile to help. We have never had one issue with ARC's services or support. It is refreshing to deal with such an honest and flexible company. I highly recommend them to any call center looking to improve their overall operations and customer service levels.``
Jeff Wu
Houston Methodist Hospital
Increased Company Revenue Growth
``So you THINK you’re doing okay? You think the first interaction your team has with a potential client, or existing client, is good? After all, YOU trained your team on how to answer the phone. Right? Possibly you are right, however, you won’t know the truth unless you “inspect what you expect.” Cheryl and her team are the key to making sure that you truly do “have them at hello.” Don’t leave this important aspect to chance and assumption!``
Coleen A. Ellis
The Pet Loss Center
Higher Customer Satisfaction and Retention
``I feel better now that I know the coach and know all the preparation they put into understanding our company. I feel like they are part of the team now. I was impressed with the fact that they have already profiled our coordinators and understand the best tactics to train them with. I feel your company has really invested time and energy into understanding our objectives. There is no doubt we will get better with your continued support.``
Tom Southerland
Neff Rental
eBook: 4 Ways to Transform & Optimize Your Contact Center
Ready to transform your contact center? Download our free guide to get started.
Here’s what you’ll learn:
- How Speech Analytics are changing CX.
- How to gain valuable insights that put you years ahead of your competitors.
- The keys to creating a thriving culture.
- How to improve customer experience and reduce lost revenue with omnichannel strategies.

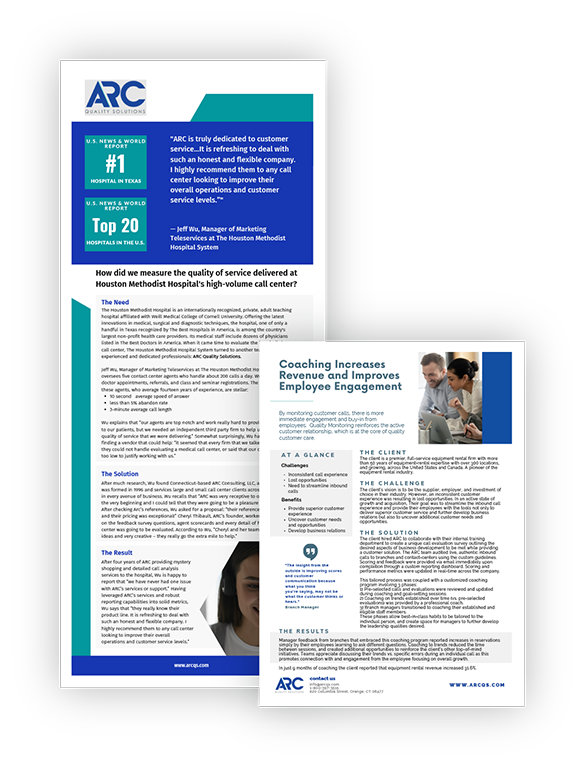
Featured Case Study: CX at a Top-Ranked Hospital
Measuring the quality of service delivered
at a Hospital's high-volume call center
Additional Case Studies
Coaching Increases Revenue and Improves
Employee Engagement
How we measured empathy in the B2B/B2C Veterinary Industry
Improving Call Effectiveness scores through an Omnichannel Monitoring Approach
Latest CX Insights
Explore our blog for insightful articles, and ideas about optimizing the Customer Experience
Is Your Contact Center QA Program Actually Working?
As a contact center manager, you are tasked with a critical responsibility: ensuring exceptional…
Elevating Banking Service with Expert Mystery Shopping
In the financial services industry, customer experience is no longer just a metric—it is the…
How Our Boutique QA Model Protects Your CX Investment and Powers Growth
Discover why ARC's unique combination of human insight and data-driven solutions makes us the…
Elevating Employee Performance Through Informed Coaching
Employee development is one of the most significant yet complex challenges organizations face…
Book a Meeting
Let's talk about your company's goals and needs!
Cheryl Thibault,
Founder of ARC

